


Many business owners find their monthly PPC reporting confusing. It’s easy to get lost in numbers like clicks and impressions. But these numbers don’t always show the whole picture.
Your marketing should clearly impact your bottom line. We think pay-per-click reporting should focus on what really counts. This includes qualified leads, booked customers, and actual revenue.
To plan your strategy, start with a simple formula. Multiply your expected cost per lead by your desired lead volume. Remember, this is a planning estimate, not a promise of future results.
By focusing on these outcomes, you can stop guessing. Start growing your business with confidence.
Key Takeaways
- Focus on business outcomes like revenue instead of vanity metrics.
- Use your monthly data as a practical tool for decision-making.
- Calculate your budget by multiplying cost per lead by lead volume.
- View your budget formula as a planning estimate, not a guarantee.
- Prioritize metrics that reveal if your ads are producing useful results.
Understanding the Importance of PPC Reporting
Effective PPC reporting is key to turning data into smart business moves. It’s not just about numbers; it’s about telling your company’s growth story.
What is PPC Reporting?
PPC reporting is all about gathering and making sense of campaign data. It looks at ad spend, traffic, conversion rates, lead quality, and revenue.
Many start with a basic PPC dashboard showing top metrics. But true PPC analytics turns that into a powerful tool. It helps you see where your budget is effective and where it’s not.
“Data is only as valuable as the actions you take based on what you have learned.”
Why It Matters for Small Businesses
Managing a digital ad account takes a lot of time. Simple campaigns need 3 to 5 hours a week, while complex ones need 8 to 10. Without good reporting, those hours can be wasted.
The main goal of reports is to save your budget. By checking your PPC analytics often, you can stop bad ads before they cost too much. This keeps your marketing strategy in line with your business goals.
| Campaign Complexity | Weekly Time Investment | Reporting Focus |
|---|---|---|
| Simple | 3–5 Hours | Basic Spend & Clicks |
| Moderate | 5–8 Hours | Conversion & Lead Quality |
| Complex | 8–10+ Hours | Revenue & ROI Tracking |
A good PPC dashboard gives you the clarity to make smart, quick decisions. Treating reporting as a core function means you stop guessing and start growing with confidence.
Key Metrics Every Small Business Owner Should Monitor
Effective pay-per-click reporting is about more than just curiosity. It’s about real business growth. Many owners focus too much on how many people saw an ad. But, they forget about how many actually became customers.
To make smart decisions, you need to look at digital marketing metrics that show real results. It’s important to compare these numbers to your total revenue. Don’t rely on just one number.
Click-Through Rate (CTR)
Your Click-Through Rate shows how often people click on your ad. It tells you if your message is hitting the right audience.
A high CTR means your ad is doing well. But, remember, a click doesn’t always mean a sale.
Conversion Rate
The conversion rate shows how many clicks turn into actions, like a phone call or a form submission. This is where intent meets action.
If you have lots of traffic but a low conversion rate, your website might need work. You want to make sure people find what they need when they click your ad.
Cost Per Acquisition (CPA)
Cost Per Acquisition is the key to financial success. It shows how much you spend to get one customer or lead.
Lead costs can vary a lot. So, compare your results to your own past data. Here’s what to focus on:
- CTR: Measures initial engagement and ad relevance.
- Conversion Rate: Measures the effectiveness of your landing page.
- CPA: Measures the actual profitability of your digital marketing metrics.
By watching these three key areas of pay-per-click reporting, you move from guessing to data-driven decisions. Always choose metrics that directly impact your bottom line.
Analyzing Ad Performance
Many business owners think spending their whole budget means they’re doing well. But, the truth is different. Real ad performance analysis looks beyond just spending to see if it’s working.
Ad Spend and Budgeting
It’s important to compare what you planned to spend with what you actually did. Just because you hit your daily limit doesn’t mean your ads are effective. They might not be reaching the right people or bringing in quality traffic.
When you boost your budget, it changes the game. Your ads might end up in more expensive auctions. This could make the quality of leads you get worse.
Quality Score Insights
Your Quality Score is like a diagnostic signal for your ads. It shows how well your ads match your landing pages and how likely people are to click on them. This score affects how much you pay for each click.
A high score means better ad rank and lower costs. By focusing on these insights, you can boost your ad performance analysis without spending more.
Your aim is to make every dollar count. Make sure your landing pages match your ad copy. This creates a smooth experience that search engines reward with better placement and lower costs.
Using Google Ads for Complete PPC Reporting
Effective Google Ads reporting begins with knowing what success means for your business. Without clear goals, your dashboard is just a bunch of numbers without meaning. We guide you to focus on actions that increase revenue, not just numbers.
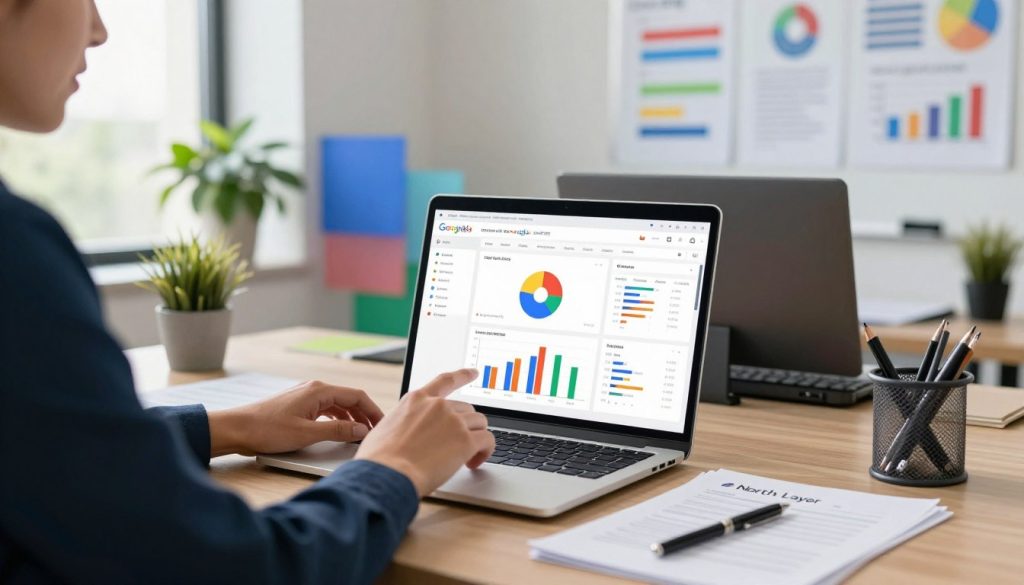
Setting Up Goals in Google Ads
Before you start using automated bidding or comparing campaigns, make sure your conversion tracking is right. You should track every important action, like form completions and online purchases. If you don’t track these, your optimization will be based on wrong data.
For local service businesses, call tracking is essential. Phone leads can make up 40% to 70% of all inquiries, but they’re invisible if you only track website clicks. Make sure your setup includes:
- Dynamic phone number insertion to track calls from ads.
- Verified form submission tracking on your “Thank You” pages.
- Clear value assignments for different types of leads.
“Data is only as valuable as the questions you ask of it. When you track the right actions, you stop guessing and start growing.”
Leveraging Google Analytics for Data
Connecting your account to Google Analytics gives you deeper insights into user behavior on your site. While your ad dashboard shows who clicked, analytics shows what they did next. This helps you see if your landing pages are engaging or if visitors leave quickly.
By linking these platforms, you can look at assisted conversion paths. This shows how different ads lead to a sale. This Google Ads reporting strategy lets you see the whole customer journey, not just the last click. You’ll understand which pages convert best and where your budget is wasted on low-intent traffic.
Tracking Campaign Performance Over Time
Creating a routine to track your marketing efforts turns data into useful insights. Without a regular schedule, it’s easy to miss important trends. A consistent approach helps you focus on long-term growth, not just short-term changes.
Monthly Reporting Essentials
A good PPC reporting routine goes beyond the basics. It’s important to look at the whole process to see how your budget affects your business. Here are the key metrics to track every month:
- Total Spend: Keep your budget in line with your financial goals.
- Impressions and Clicks: See how well your messages are reaching and engaging people.
- Click-Through Rate (CTR): Check if your ads are grabbing attention.
- Conversions and CPA: Watch how much it costs to get a new customer.
- Lead Quality and Revenue: Link your ad clicks to real sales.
Identifying Trends and Patterns
Looking at one month can be misleading because it might hide big changes. By comparing now to before, you can spot real shifts. This campaign tracking helps you see if your changes are working.
“Data is only as valuable as the insights you derive from it. Look beyond the surface to understand the ‘why’ behind your numbers.”
Use a 90-day review to see if your Google Ads reporting shows better results. Look closely at different areas to find new chances:
- Search Terms: Find out which searches lead to serious interest.
- Service Categories: See which services bring in the most value.
- Devices and Locations: Adjust your bids based on where your customers are.
- Conversion Types: Focus on the actions that really matter to your business.
By looking at these patterns, you can make better, strategic choices. This careful approach is key to lasting success in digital ads.
Adjusting Strategies Based on Reports
Turning raw numbers into actionable improvements is key to a successful PPC strategy. Regular ad performance analysis lets you make smart decisions to save your budget. You can refine your strategy to make every dollar count.

Optimizing Underperforming Ads
When reports show ads that don’t convert, you need to act fast. Start by checking your search terms for low-intent queries that waste your budget. Adding these as negative keywords stops your ads from showing for irrelevant searches, boosting your efficiency.
If an ad gets a lot of clicks but few conversions, the problem might be the landing page. Make sure your page content matches your ad’s promise. Sometimes, a simple call to action or form simplification can greatly improve results.
Testing and Iterating with A/B Testing
A/B testing is the best way to improve your campaigns without guessing. Change only one thing at a time, like a headline or image. This way, you know exactly what change improved your results.
Don’t change too many things at once. It’s hard to tell which change worked. Also, wait for enough data before making decisions. Making choices based on small samples can lead to misleading conclusions.
| Action Taken | Primary Goal | Expected Outcome |
|---|---|---|
| Add Negative Keywords | Reduce wasted spend | Higher conversion rate |
| Update Landing Page | Improve user experience | Lower bounce rate |
| Refine Ad Headlines | Increase relevance | Higher click-through rate |
| Adjust Bid Strategy | Optimize for ROI | Better cost per acquisition |
Regular ad performance analysis keeps you ahead of market changes. By making small, steady improvements, you build a stronger, more profitable ad account over time.
Understanding Customer Behavior Through PPC Data
Looking beyond just click counts lets you see the real people behind your data. Treating every visitor the same misses the unique habits that drive revenue. Good PPC analytics reveal the specific habits and preferences of your target market.
Audience Segmentation
It’s important to sort your traffic by meaningful business traits, not just volume. Campaign tracking helps you see how different groups interact with your services. For instance, a mobile user might have different needs than a desktop user.
Segmenting by location, device, and buying intent gives you clarity. This way, you avoid wasting resources on low-intent clicks. Tailoring your message to these segments can boost engagement and results.
Insights into Purchase Patterns
Not all leads are equal to your business. Some channels might bring in many cheap leads that rarely convert. By linking search behavior with purchase patterns, you get online advertising insights that guide your budget.
It’s key to focus on lead quality for long-term growth. Track which campaigns lead to sales, not just form submissions. These online advertising insights help you spend on strategies that add the most value. Smart campaign tracking turns data into a roadmap for lasting profitability.
Tools and Software for Efficient PPC Reporting
Managing your advertising data needs tools that offer clarity, not just more data. You need a system that turns raw numbers into online advertising insights. These insights should help grow your business.
Best PPC Reporting Tools for Small Businesses
You don’t need an expensive platform to track your success. Many small businesses start with simple tools. This approach is effective for learning the basics.
- Google Ads Native Reports: Great for quick checks on daily spend and basic performance metrics.
- Google Analytics: Essential for connecting your ad clicks to actual website behavior and final conversions.
- Spreadsheet Templates: A low-cost way to manually track trends if you have a smaller volume of campaigns.
- Automated PPC dashboard tools: These platforms pull data from multiple sources into one visual view, saving you hours of manual work each month.
How to Choose the Right Tool
The best software is not always the one with the most features. Look for a PPC dashboard that makes your most important data easy to understand and act on immediately.
When evaluating your options, consider these critical factors. This ensures you are not paying for “vanity metrics” that look good but do not help your bottom line:
- Data Accuracy: Ensure the tool pulls data directly from official sources without errors.
- Integration: It should connect easily with your existing CRM or call-tracking software.
- Revenue Focus: Prioritize tools that link your ad spend directly to actual leads and sales.
- Cost-Effectiveness: Avoid software that charges high monthly fees for features you do not use.
Your reporting setup should simplify your life, not complicate it. Focus on tools that provide clear online advertising insights. This way, you can spend less time staring at charts and more time making smart decisions for your business.
Common Mistakes to Avoid in PPC Reporting
Managing your ad budget well means paying close attention to details. Many business owners lose money by focusing on things like impressions. They ignore the quality of their leads instead.
Focusing on the Wrong Data
Just tracking clicks can hide the truth about your investment return. You need to watch cost per lead, conversion rates, and booked-job rates. These metrics show if your ads really bring in revenue.
Ignoring Seasonal Shifts
Search demand changes throughout the year for almost every industry. You might see a drop in performance during slow months. This doesn’t always mean your ad quality is bad. Adjusting your expectations based on these cycles helps avoid unnecessary panic and poor strategy changes.
Building a Practical Review Process
PPC reporting is a tool for making better business decisions. Create a simple monthly review that looks at your total spend against your actual revenue. This way, your data stays useful and helps you refine your targeting and improve results.